I mainly use Python to assist me in web crawling, data preprocessing and variable construction. Here are some examples of programming projects I’ve completed:
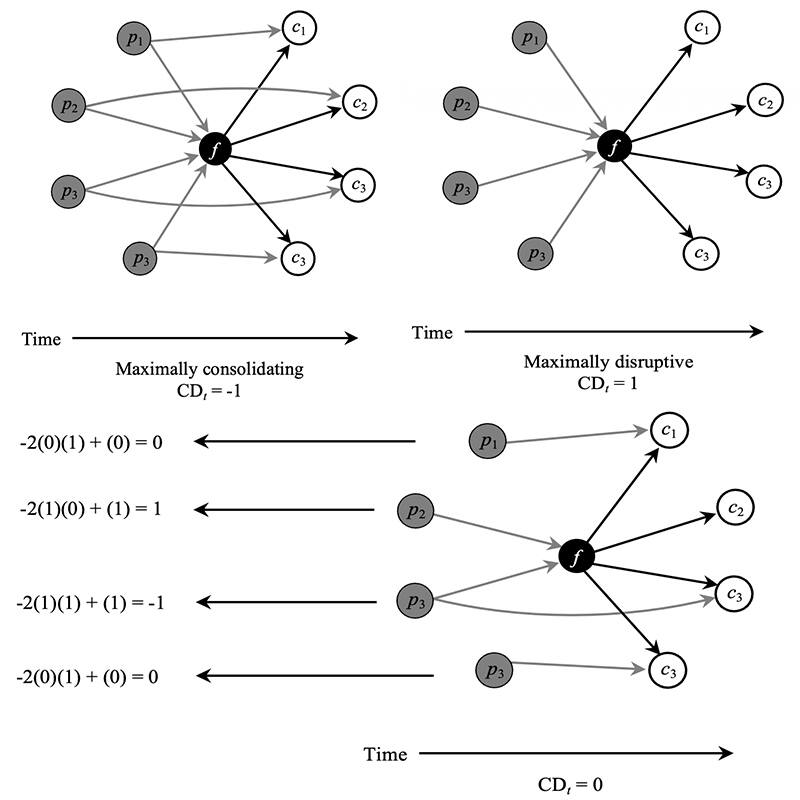
This Python script, using the Selenium package to collect patent data from the Derwent Innovations Index (DII) database, including detailed information on forward and backward citations of patent applications from relevant companies; The purpose of this project was to quantify the disruptive innovation, following the measure adopted by Wu et al. (2019) in Nature.
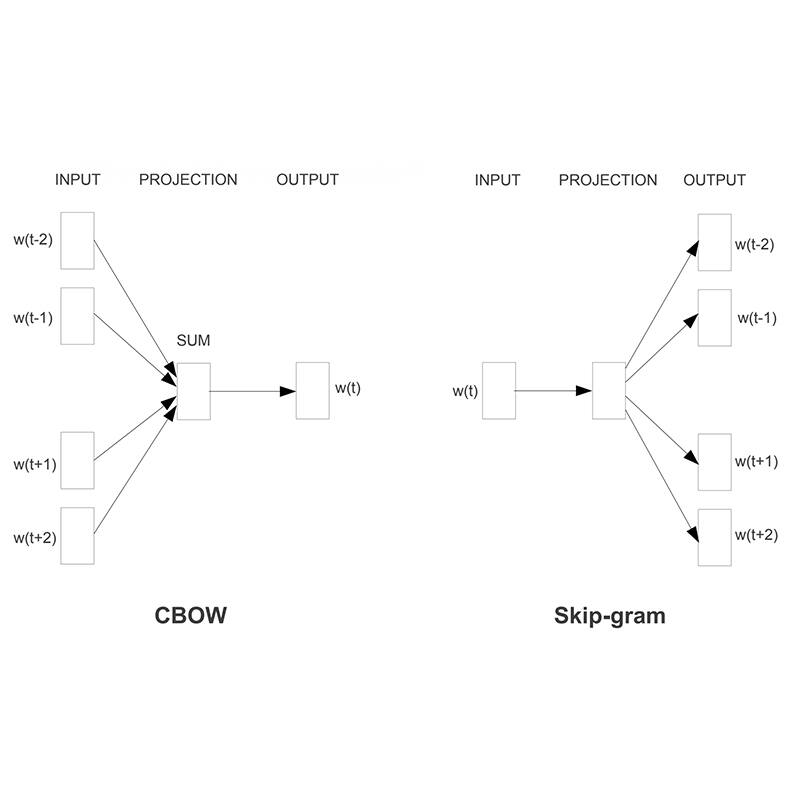
This Python script, employing the Word2Vec machine learning algorithm module, is a natural language processing technology that is more advanced than the word frequency method used by Merkley (2014), expands the initial word set to be applicable to annual reports.
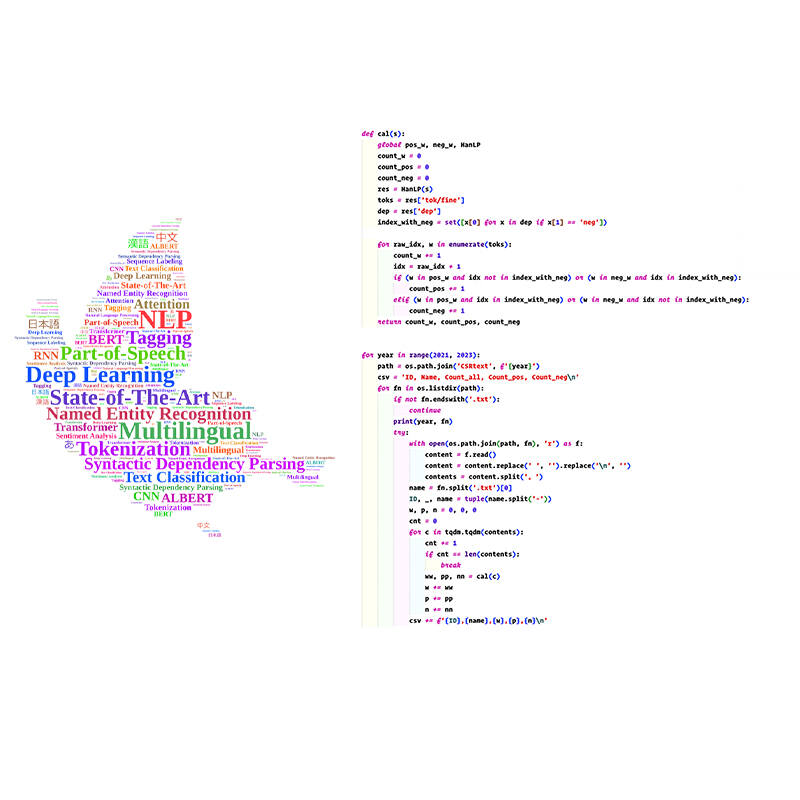
This Python script, utilizing HanLP’s pre-trained model for tokenization and dependency parsing, analyzes the sentiment tone in corporate social responsibility (CSR) reports, and caculates positive and negative words from a financial sentiment dictionary.
Stata serves as my companion for data preprocessing, variable construction, and causal inference analysis. I can do this with R as well, but Stata works best for me! When I was an undergraduate, I was able to use Stata to complete data processing for three sub-studies in less than three weeks. After two years of postgraduate study, my data analysis skills have further improved. I have received strict training in econometric techniques and am very interested in experimental methods and causal inference. In addition to being able to implement linear mixed-effects models, traditional causal inference methods (such as IV, DID, RD, etc.), I have also mastered some latest methods, such as SCM, Staggered DID, Bartik Instrument.
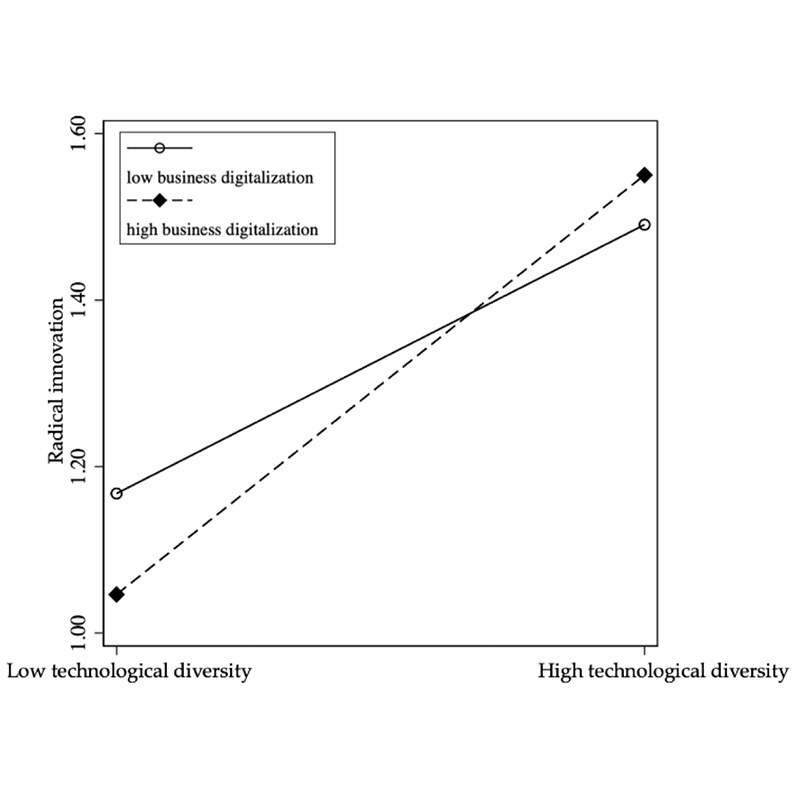
This do-file, with Stata code and results embedded, shows the main analyses about our work: “From Bytes to Breakthroughs: How Digitalization Fuels Radical Innovation with Technological Diversity.” This work was part of the China’s National Natural Science Foundation Programme titled Research on the Formation Mechanism and Model of Breakthrough Innovation in High-Tech Industries.
This do-file, with Stata code and results embedded, shows the main analyses about my undergraduate thesis: “Research on the Impact of Business Strategy on Performance from the Perspective of Agricultural Industrialization—Based on the Data of Listed Companies in the Rural Revitalization Concept Sector.” It received the Outstanding Thesis Award (the only one in the entire college).
For me, R is the perfect language for data manipulation, processing, visualization, statistical computation, and machine learning. I primarily use R for social network analysis. I have replicated two empirical studies using R and built various types of networks, such as trade networks, co-authorship networks, and executive alumni relationship networks, to propose relevant indicators. Additionally, with the help of R’s MplusAutomation package, I am able to perform all analysis related to Structural Equation Modeling (SEM).
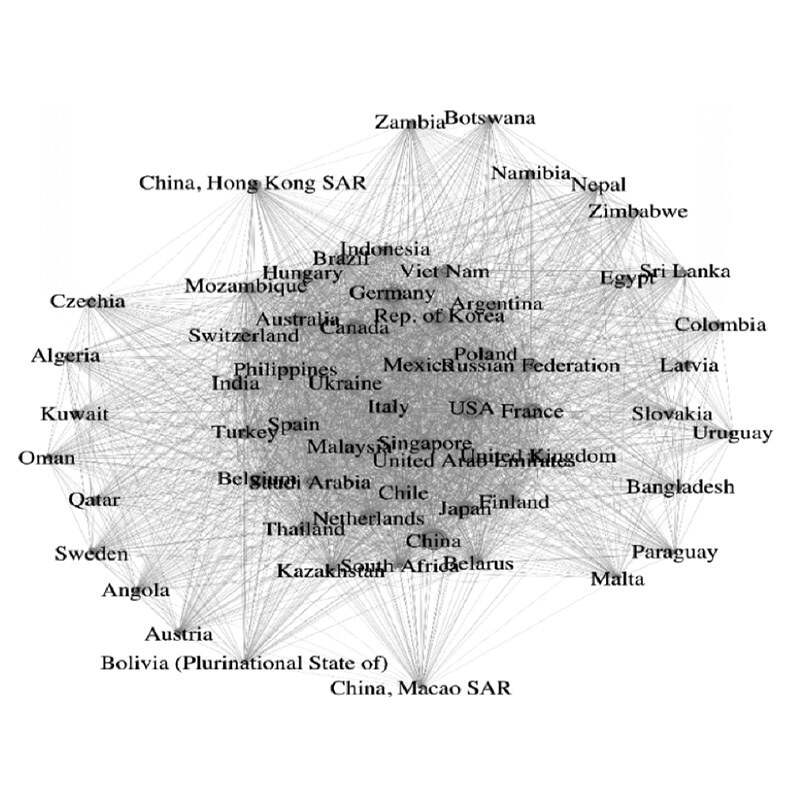
This RMarkdown file, with R code and results embedded, analyzes trade networks from 2005 to 2015. This code constructs variables like network density, node degree, and strength, and visualizes these changes to examine the impact of trade network characteristics on the trade division status of BRICS countries.
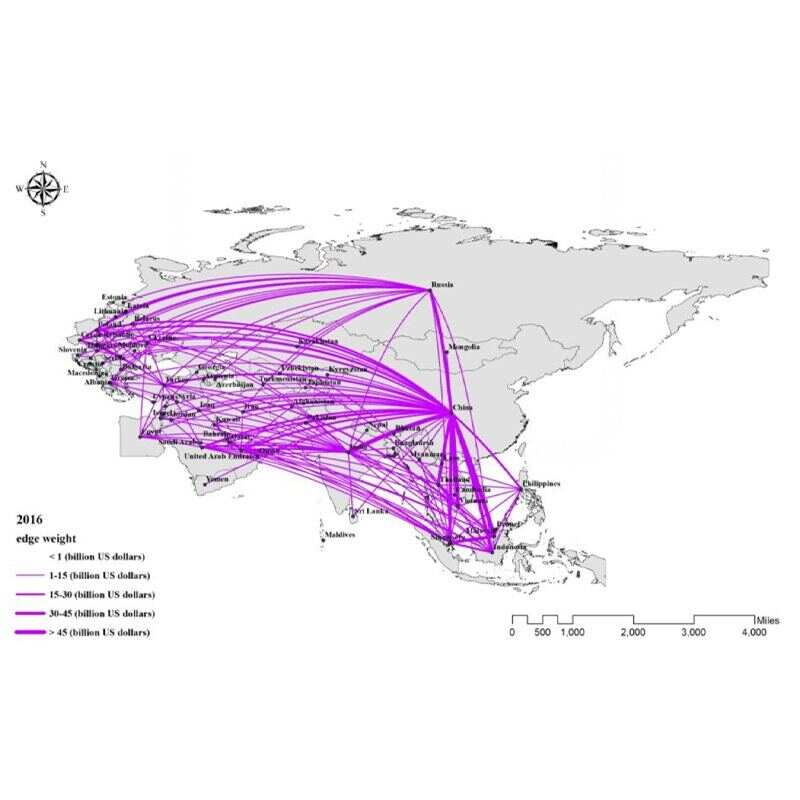
This RMarkdown file, with R code and results embedded, replicates the main analyses in Shaowei Chen and Qiang (Patrick) Qiang (2020): “The Trade Network Structure of the “One Belt and One Road” and Its Environmental Effects.” This work analyzes the structure and characteristics of the OBOR trade network, and uses three-stage least squares (3SLS) for analysis of the relationship between CO2 emissions and trade network characteristics.